Data Visualization

During the pandemic lockdown, I found TidyTuesday, an amazing online community dedicated to data visualization with the R Tidyverse. Each week, members produce creative visualizations from the same data set and share their code, making it easy for people like me to learn from others. Here, I share some of my contributions to this weekly activity.
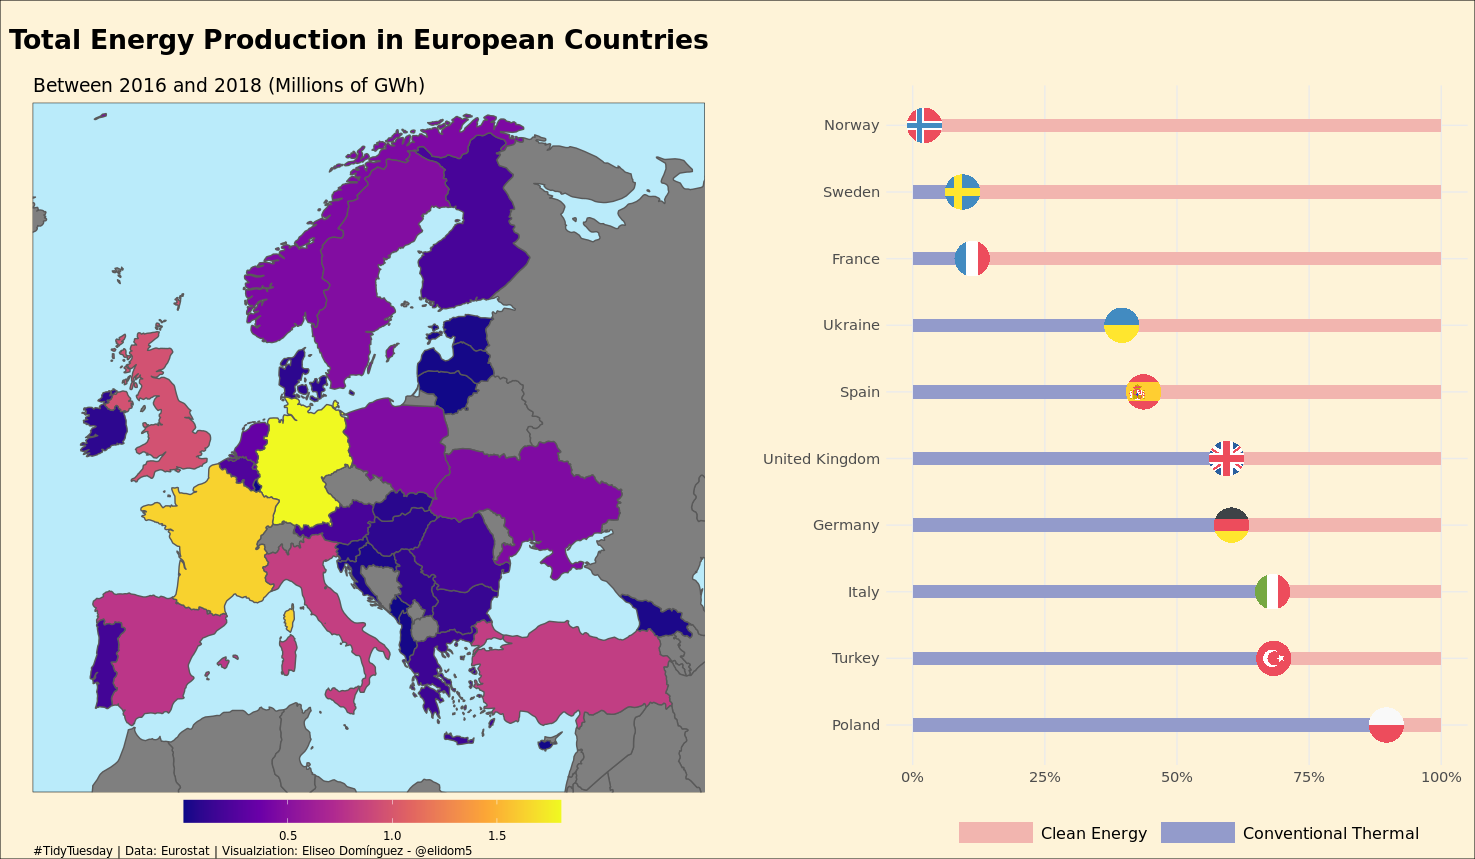
Energy Production in European Contries


Code.

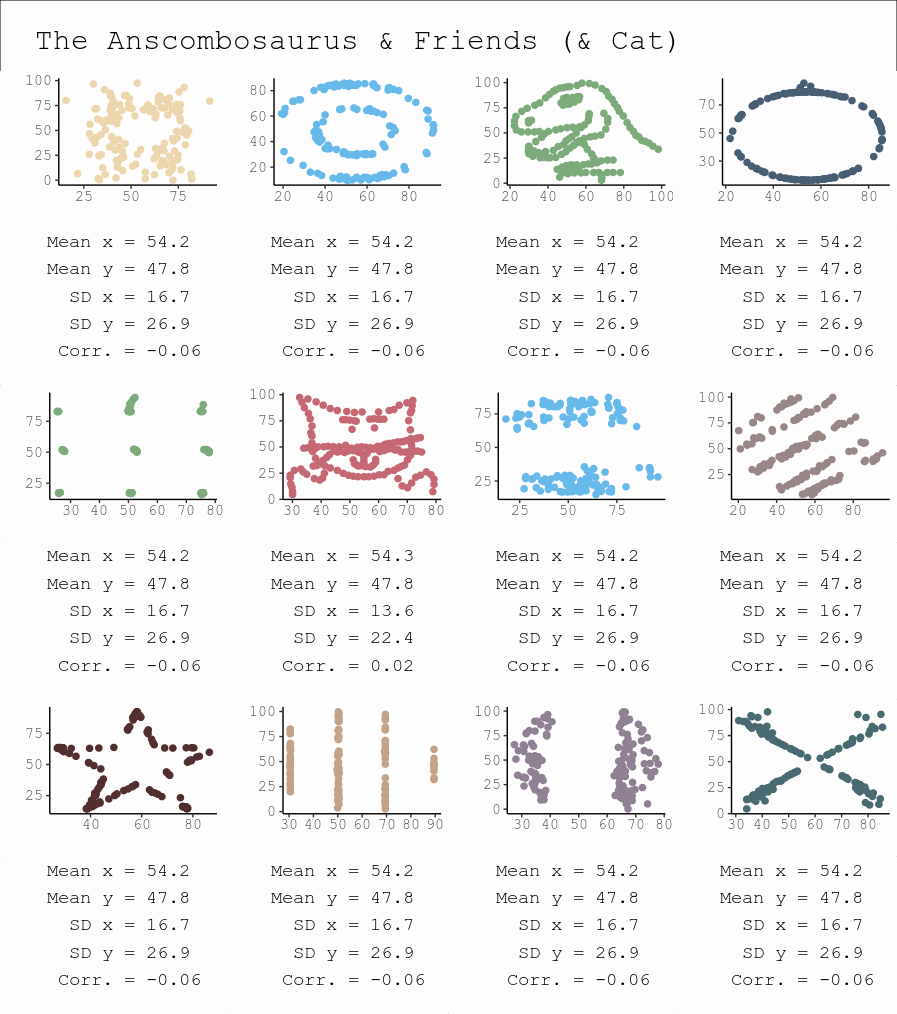
Anscombosaurus & Friends (a.k.a Find the Imposter)

Code.

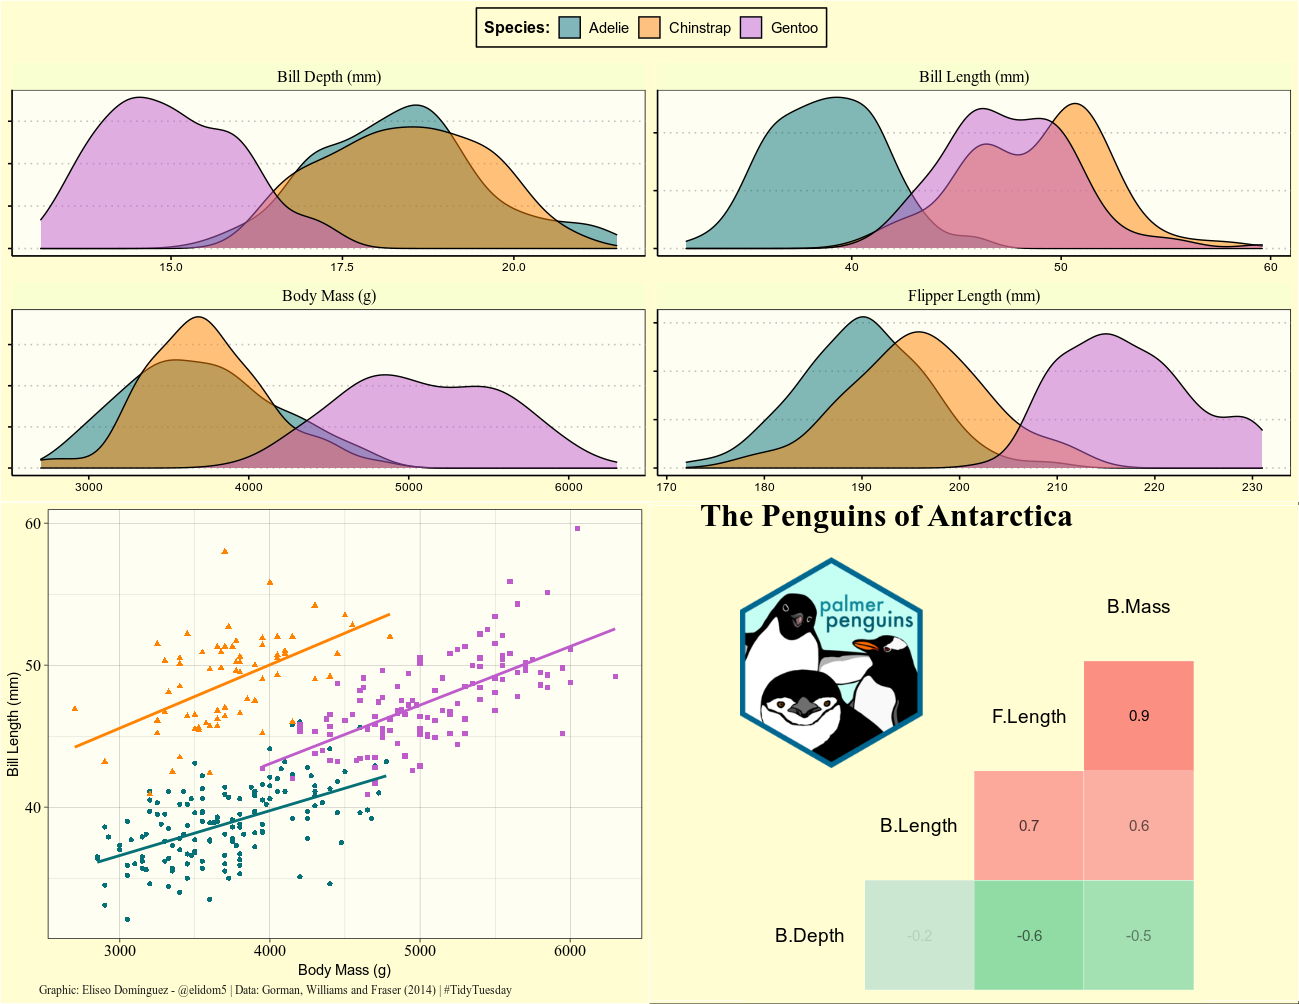
The Penguins of Antarctica


Code.

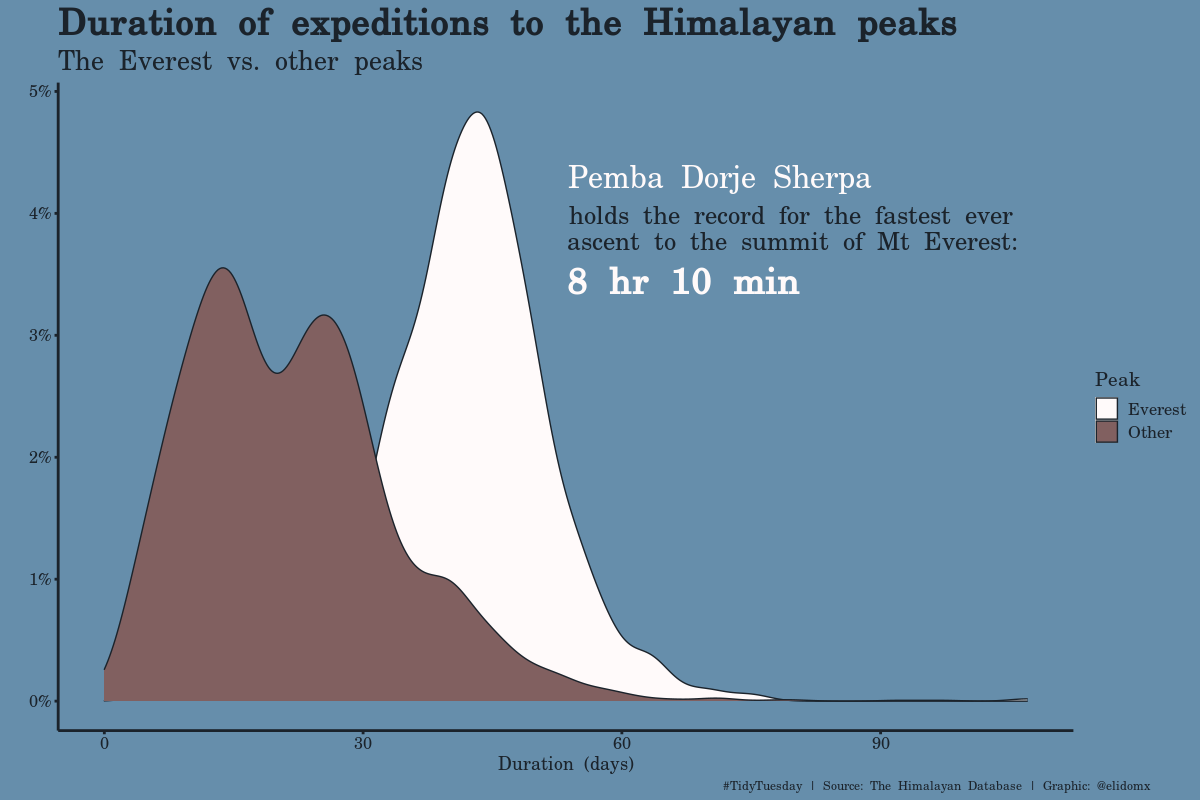
Himalayan Peaks

Code.

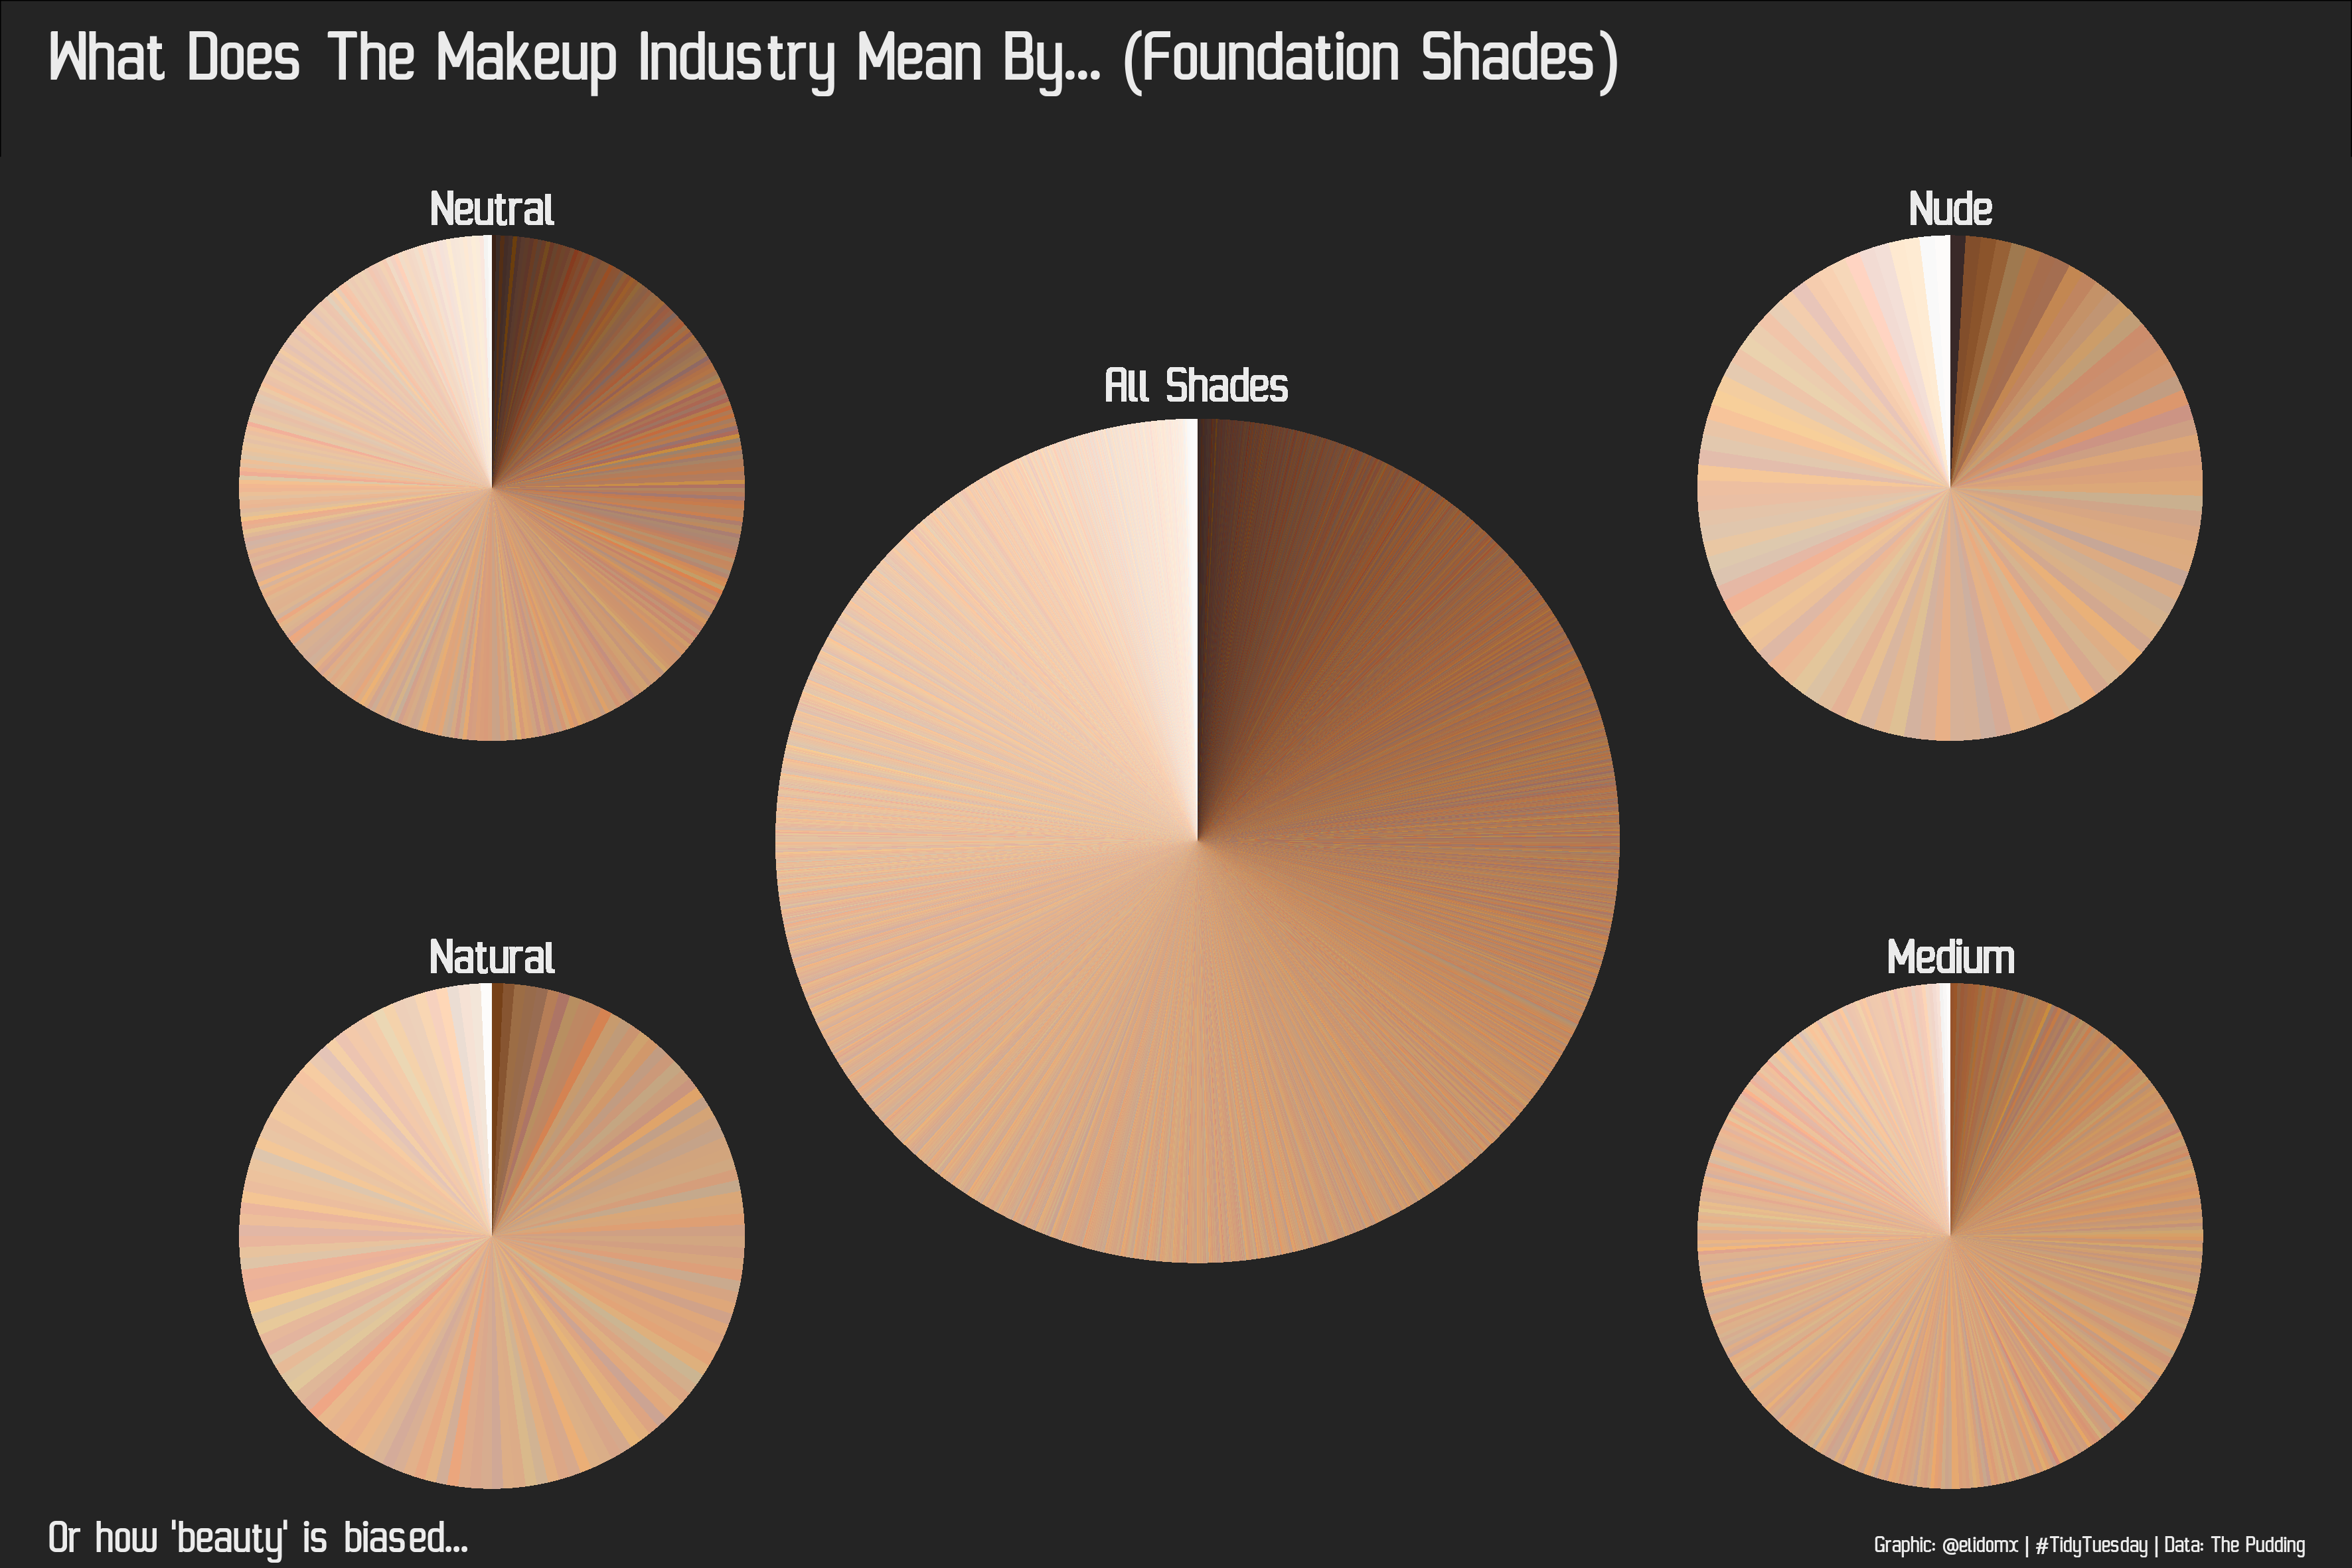
Makeup Shades


Code.

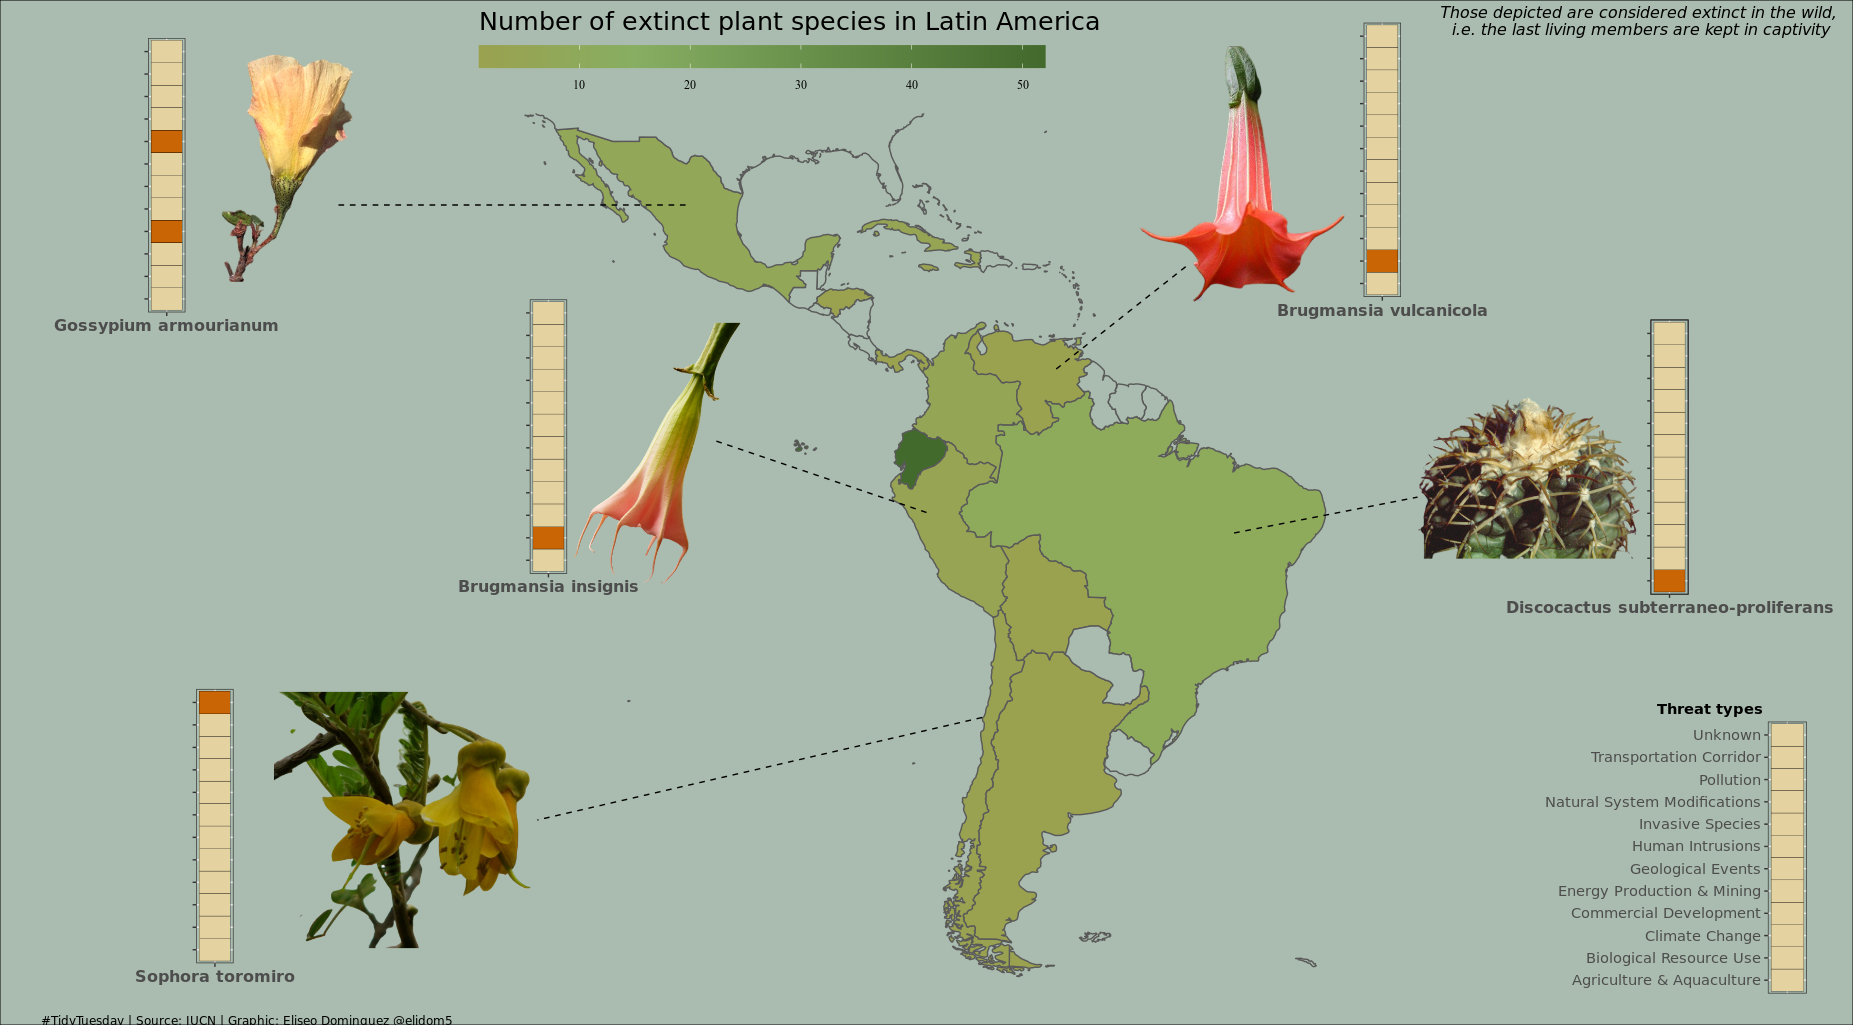
Extinct Plant Species


Code.

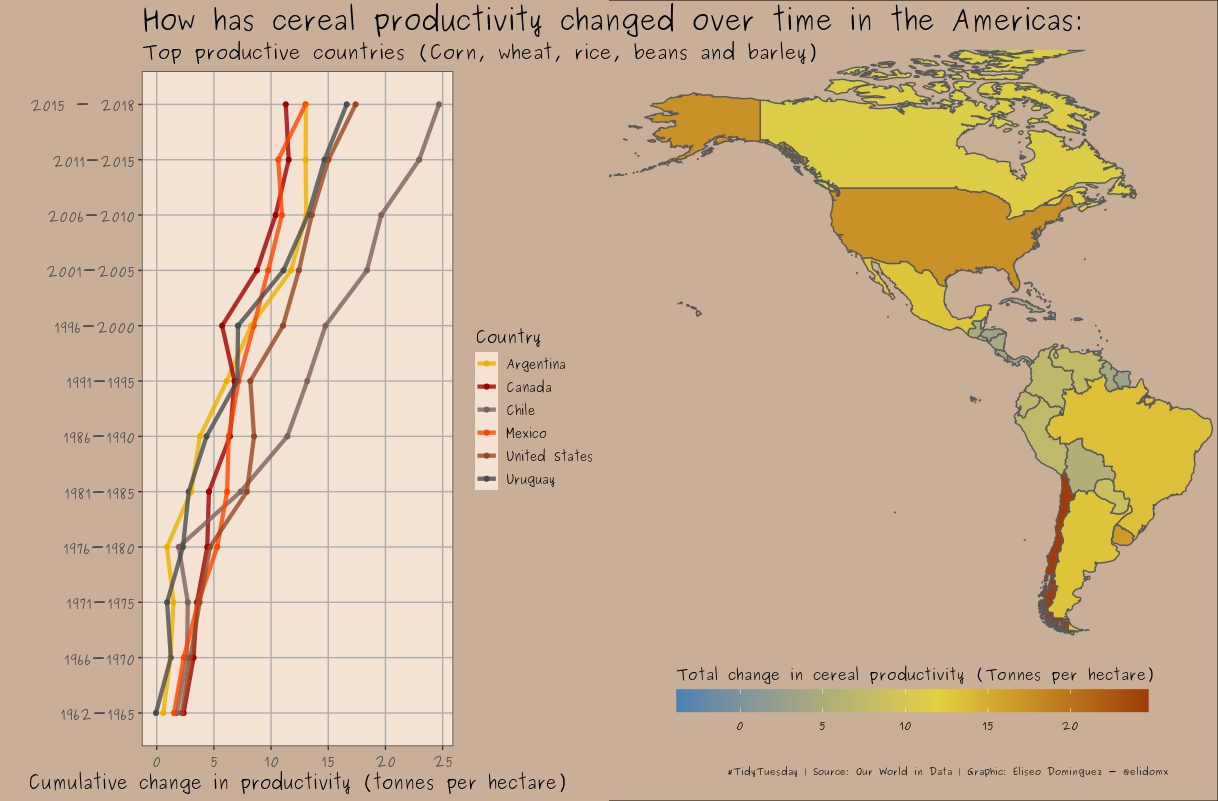
Cereal Yields in the Americas


Code.

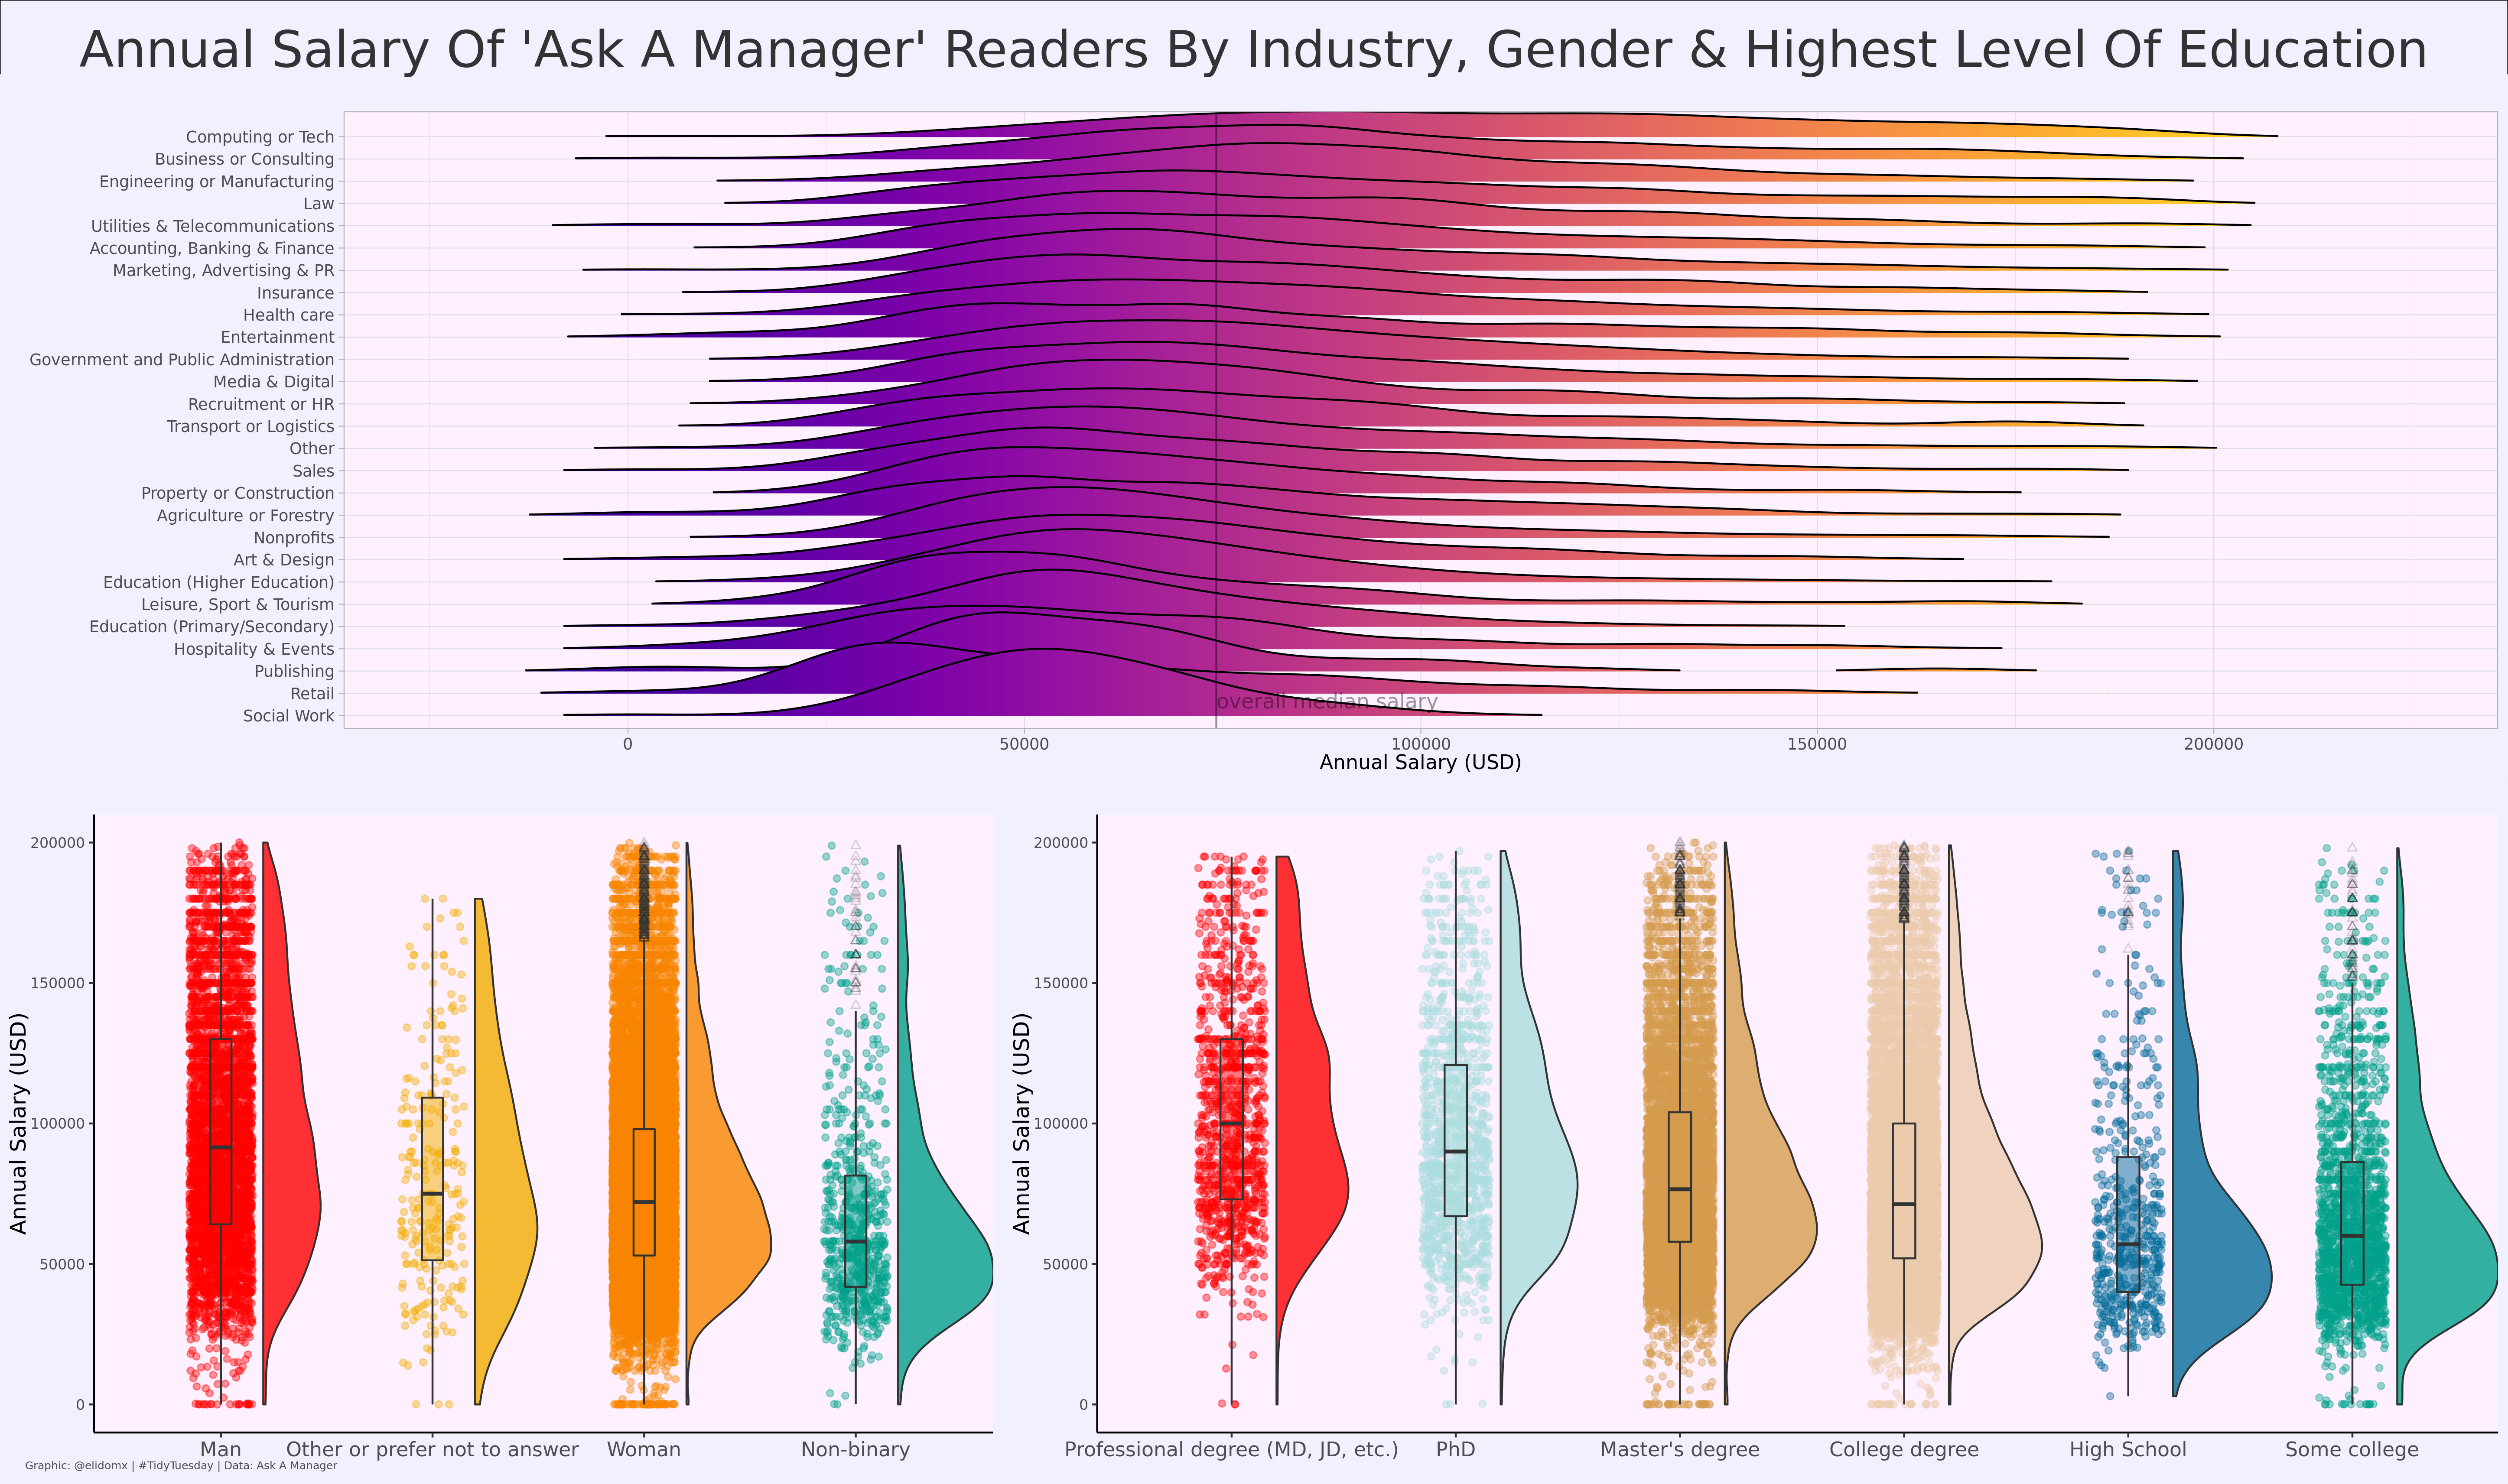
Ask a Manager


Code.

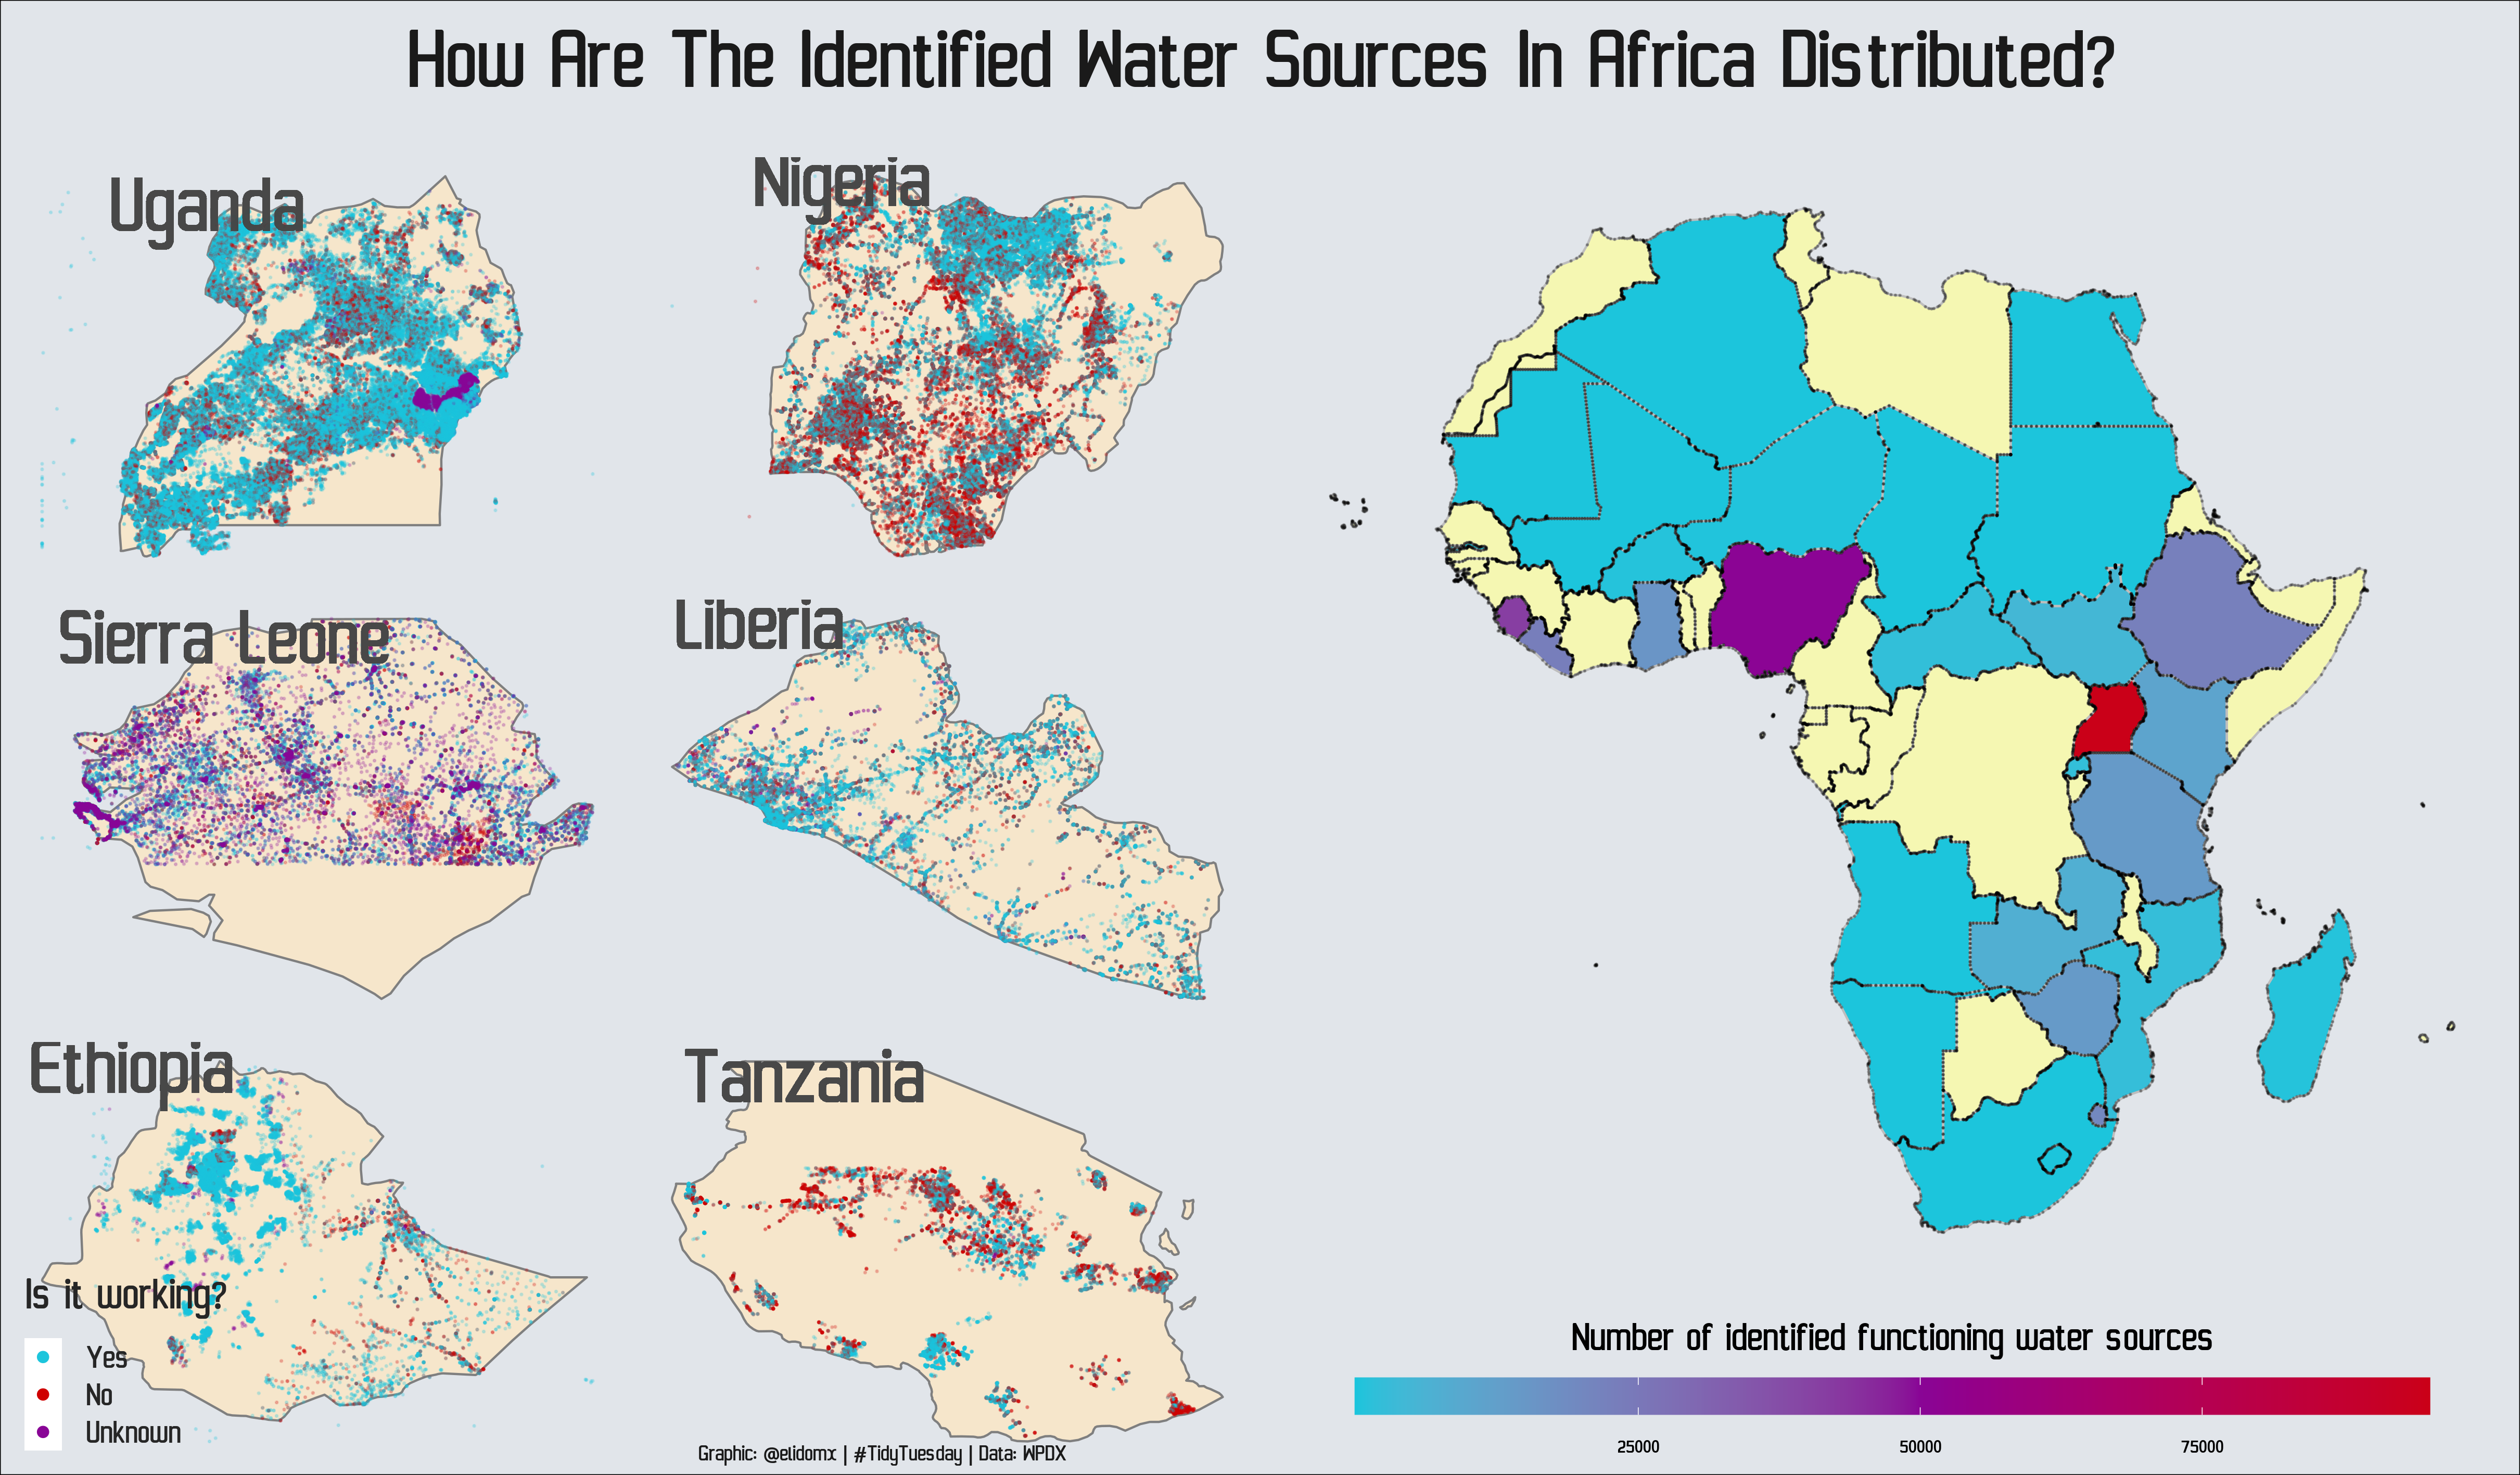
Water Sources in Africa


Code.

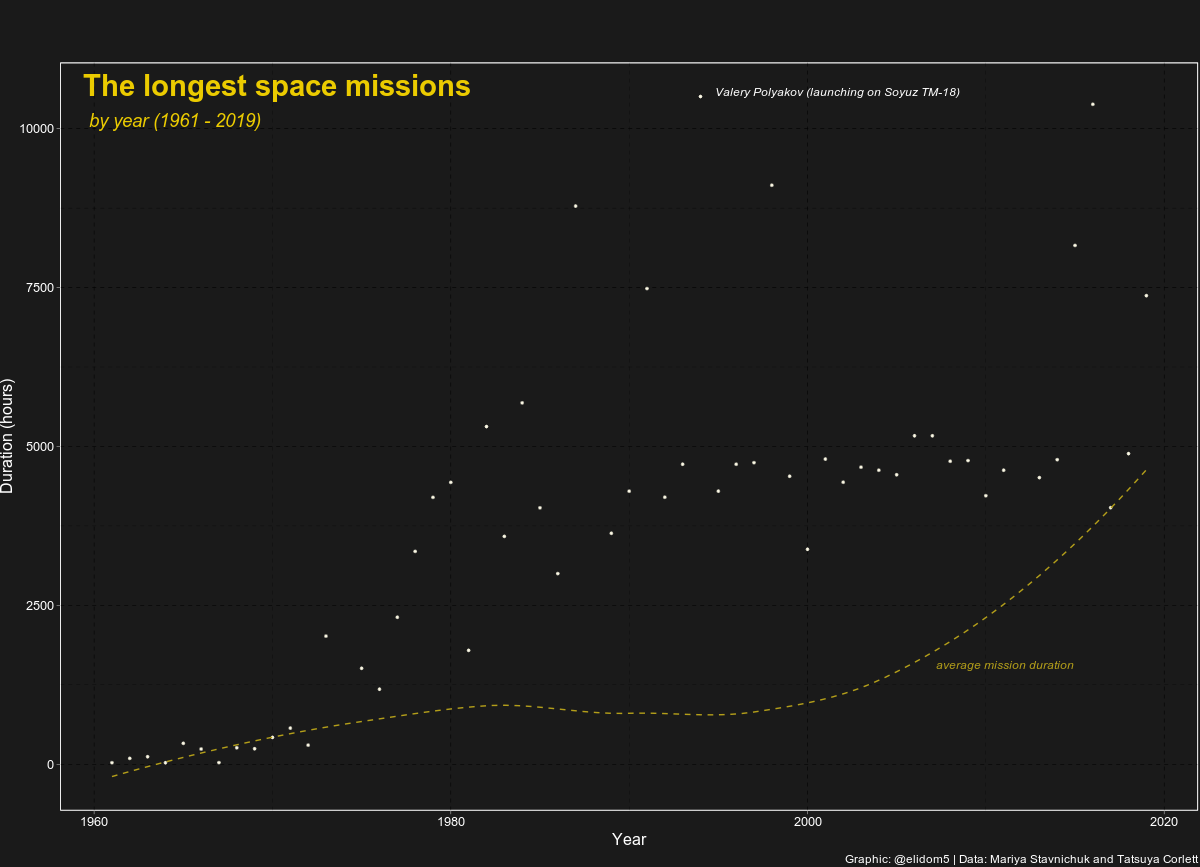
Space Missions


Code.

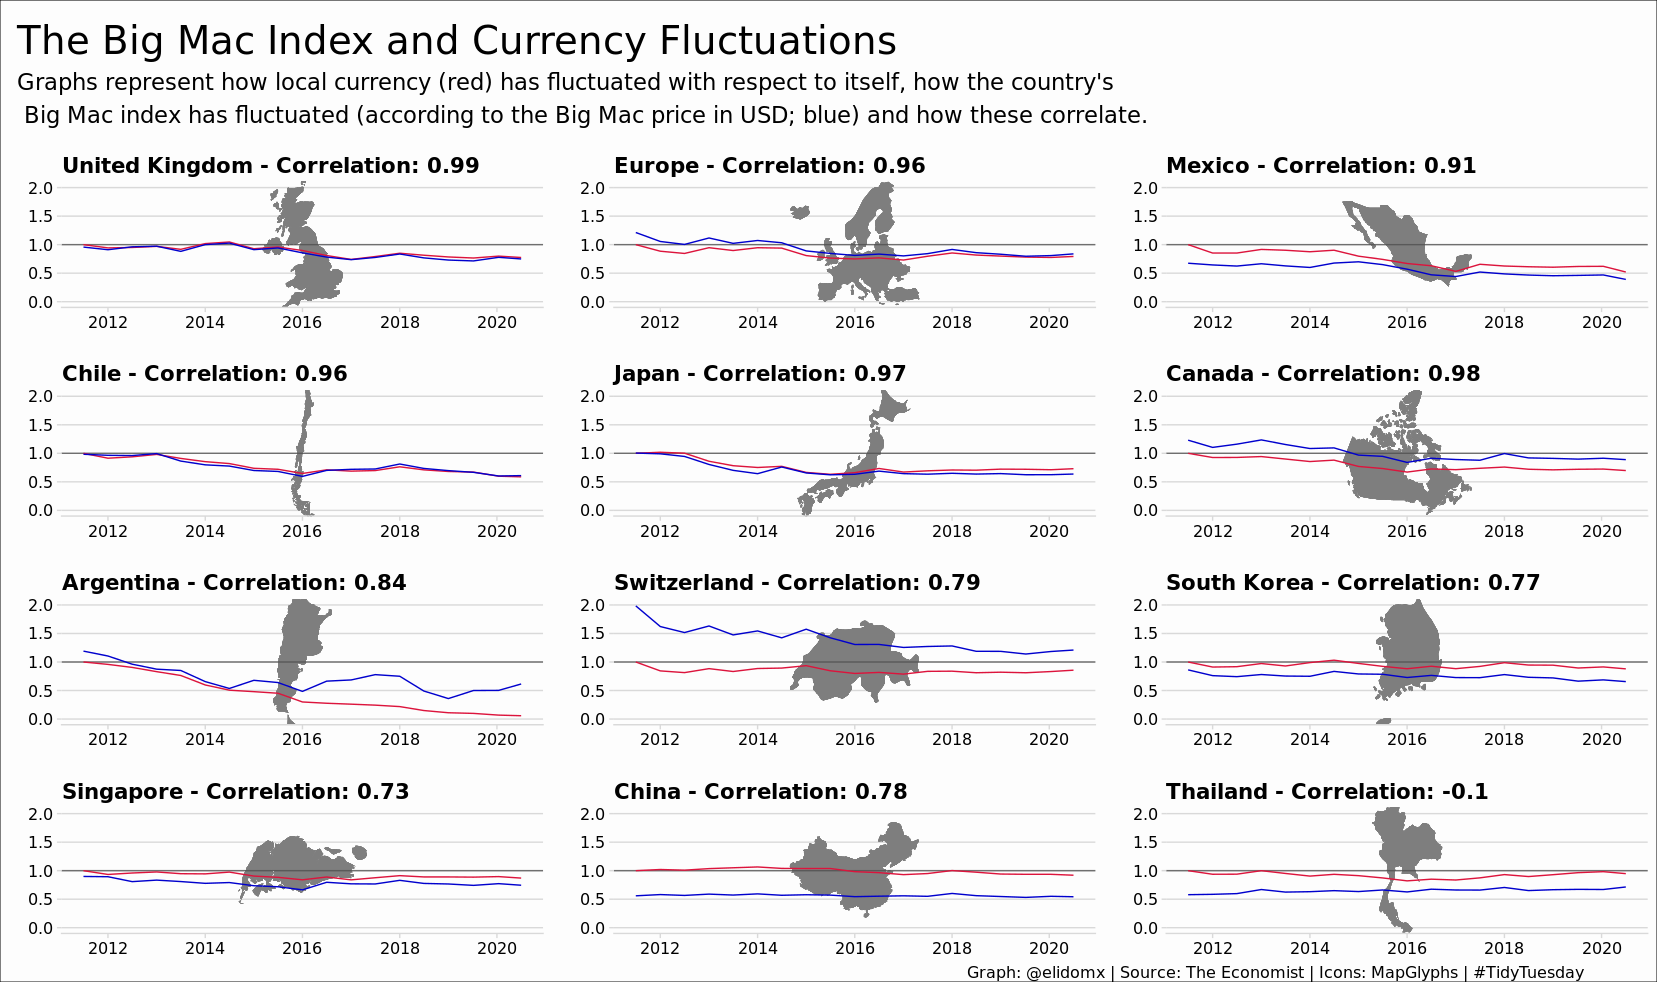
Big Mac Index


Code.